Graph view
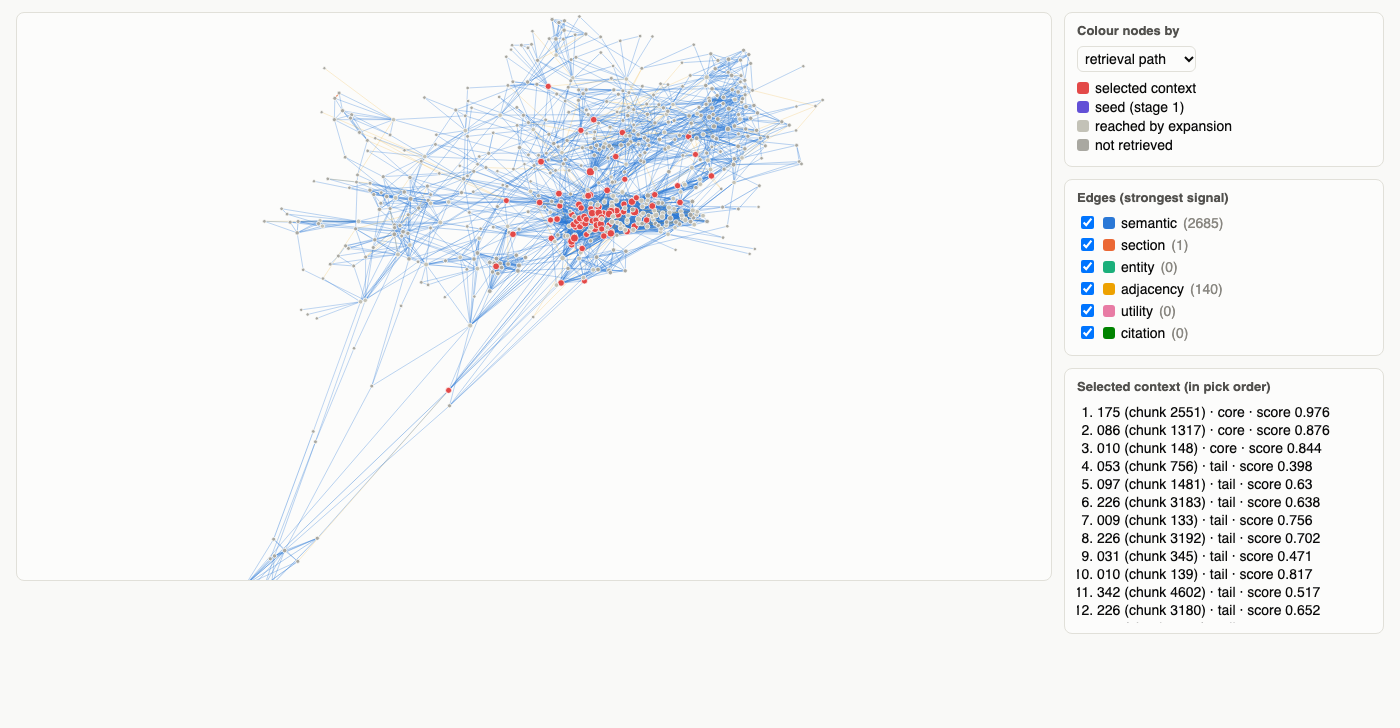
spectrafuse graph writes one self-contained HTML file that shows your index as a graph: chunks
are nodes, edges are coloured by their strongest signal, and a question's retrieval path is
highlighted (seeds, chunks reached by the graph walk, and the selected context). It is similar
to Figure 5 of the paper, and needs no internet connection.
Make one
Open the file in any browser.
| Option | CLI | Python | Default |
|---|---|---|---|
| index folder | --index |
index_dir |
required |
| output file | --out |
path |
graph.html |
| question to trace | --question |
question |
none |
| retrieval settings for that question | --set key=value |
settings |
the index's settings |
| largest number of nodes drawn | --max-nodes |
max_nodes |
1500 |
What you see
- Layout: each chunk starts at its spectral coordinates \((u_2, u_3)\), then a short force layout pulls linked chunks together and pushes the others apart.
- Edge colours: the signal that contributed most to the edge's weight (semantic, section, entity, adjacency, utility or citation).
- Retrieval path: seeds, chunks reached by graph expansion, and the chunks selected for the context, with their rank, score and the reason they were picked.
Interaction: hover a node to read its text, click it to highlight its neighbours, scroll to zoom, drag to pan, and use the checkboxes to hide signals.
Large indexes
When the index has more chunks than max_nodes, the view keeps the retrieval path, then grows
outwards from it (neighbours, then their neighbours), then adds the best-connected chunks. Lower
--max-nodes if the page feels slow in your browser.
Use the data yourself
graph_data() returns everything the page draws, as plain Python data, for your own
visualisation:
from spectrafuse.utils.graph_view import graph_data

data = graph_data("my_index", question="Where is Helios Energy based?")
data["nodes"][0]     # {"id", "x", "y", "doc", "section", "cluster", "position", "degree", "state", "text"}
data["edges"][0]     # [i, j, weight, strongest signal]
data["picked"]       # the selected chunks: id, rank, reason, doc, score